Opinion Polls for 2021 German Elections

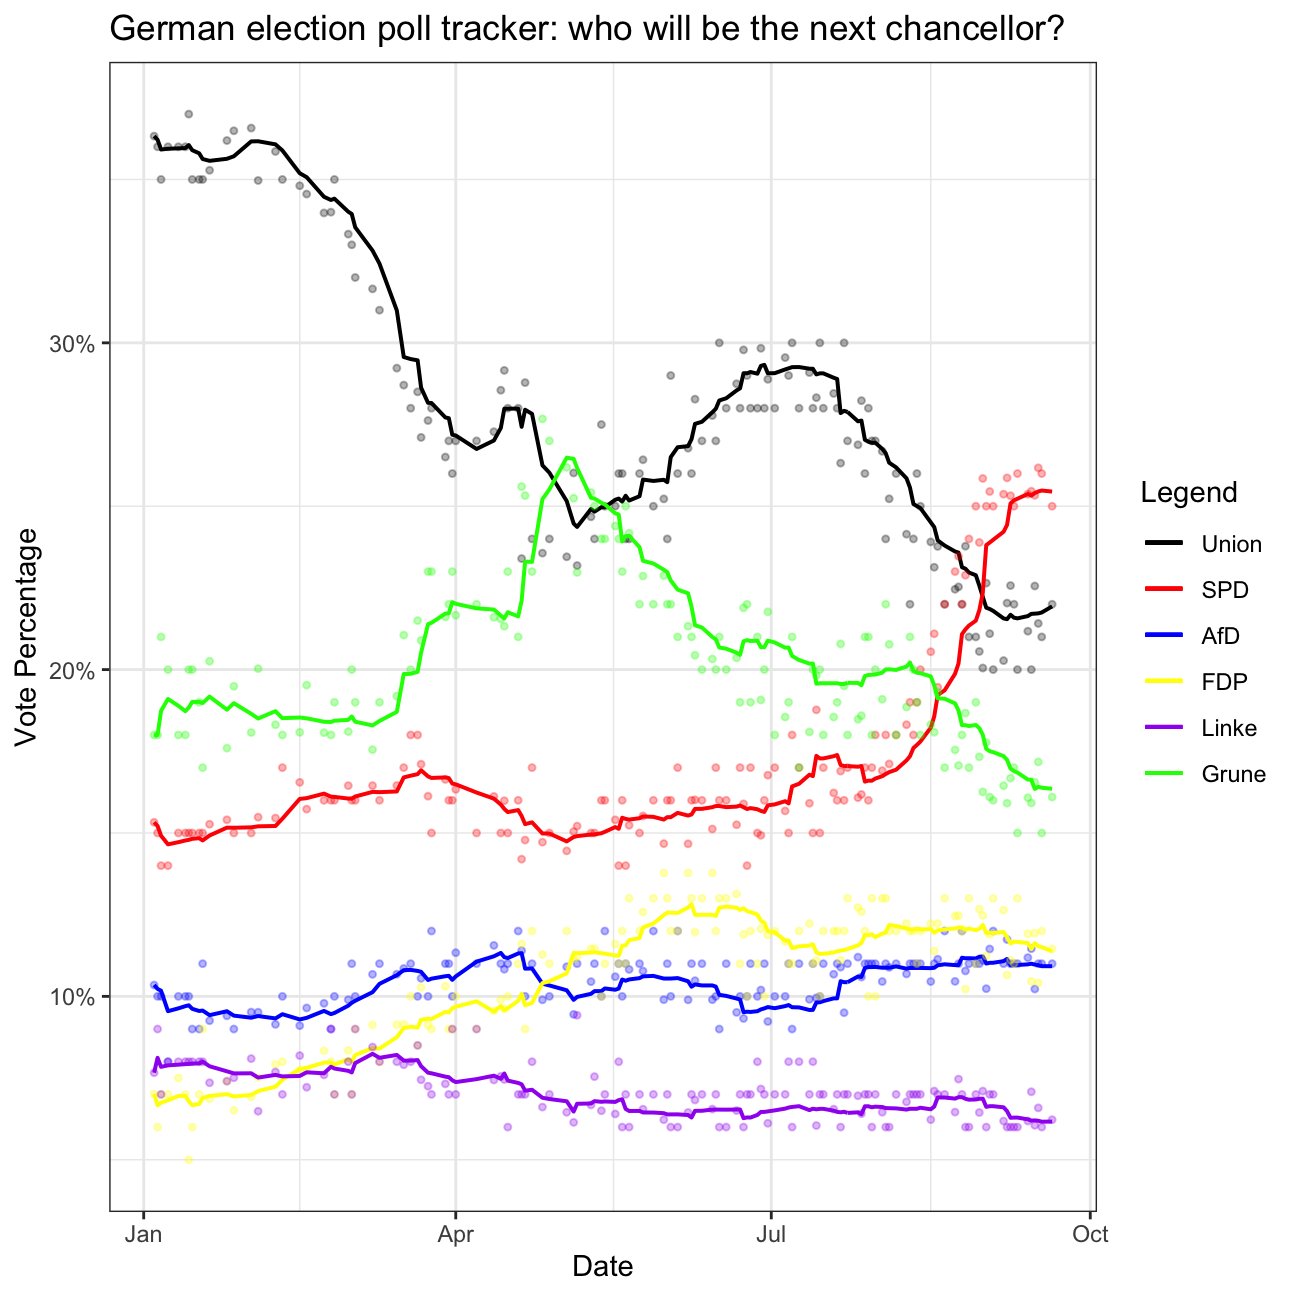
The Guardian newspaper has an election poll tracker for the upcoming German election. I reproduce the graph similar to the one produced by the Guardian, based on opinion polls since Jan 2021 that can be found at Wikipedia.
The following code will scrape the wikipedia page and import the table in a dataframe.
url <- "https://en.wikipedia.org/wiki/Opinion_polling_for_the_2021_German_federal_election"
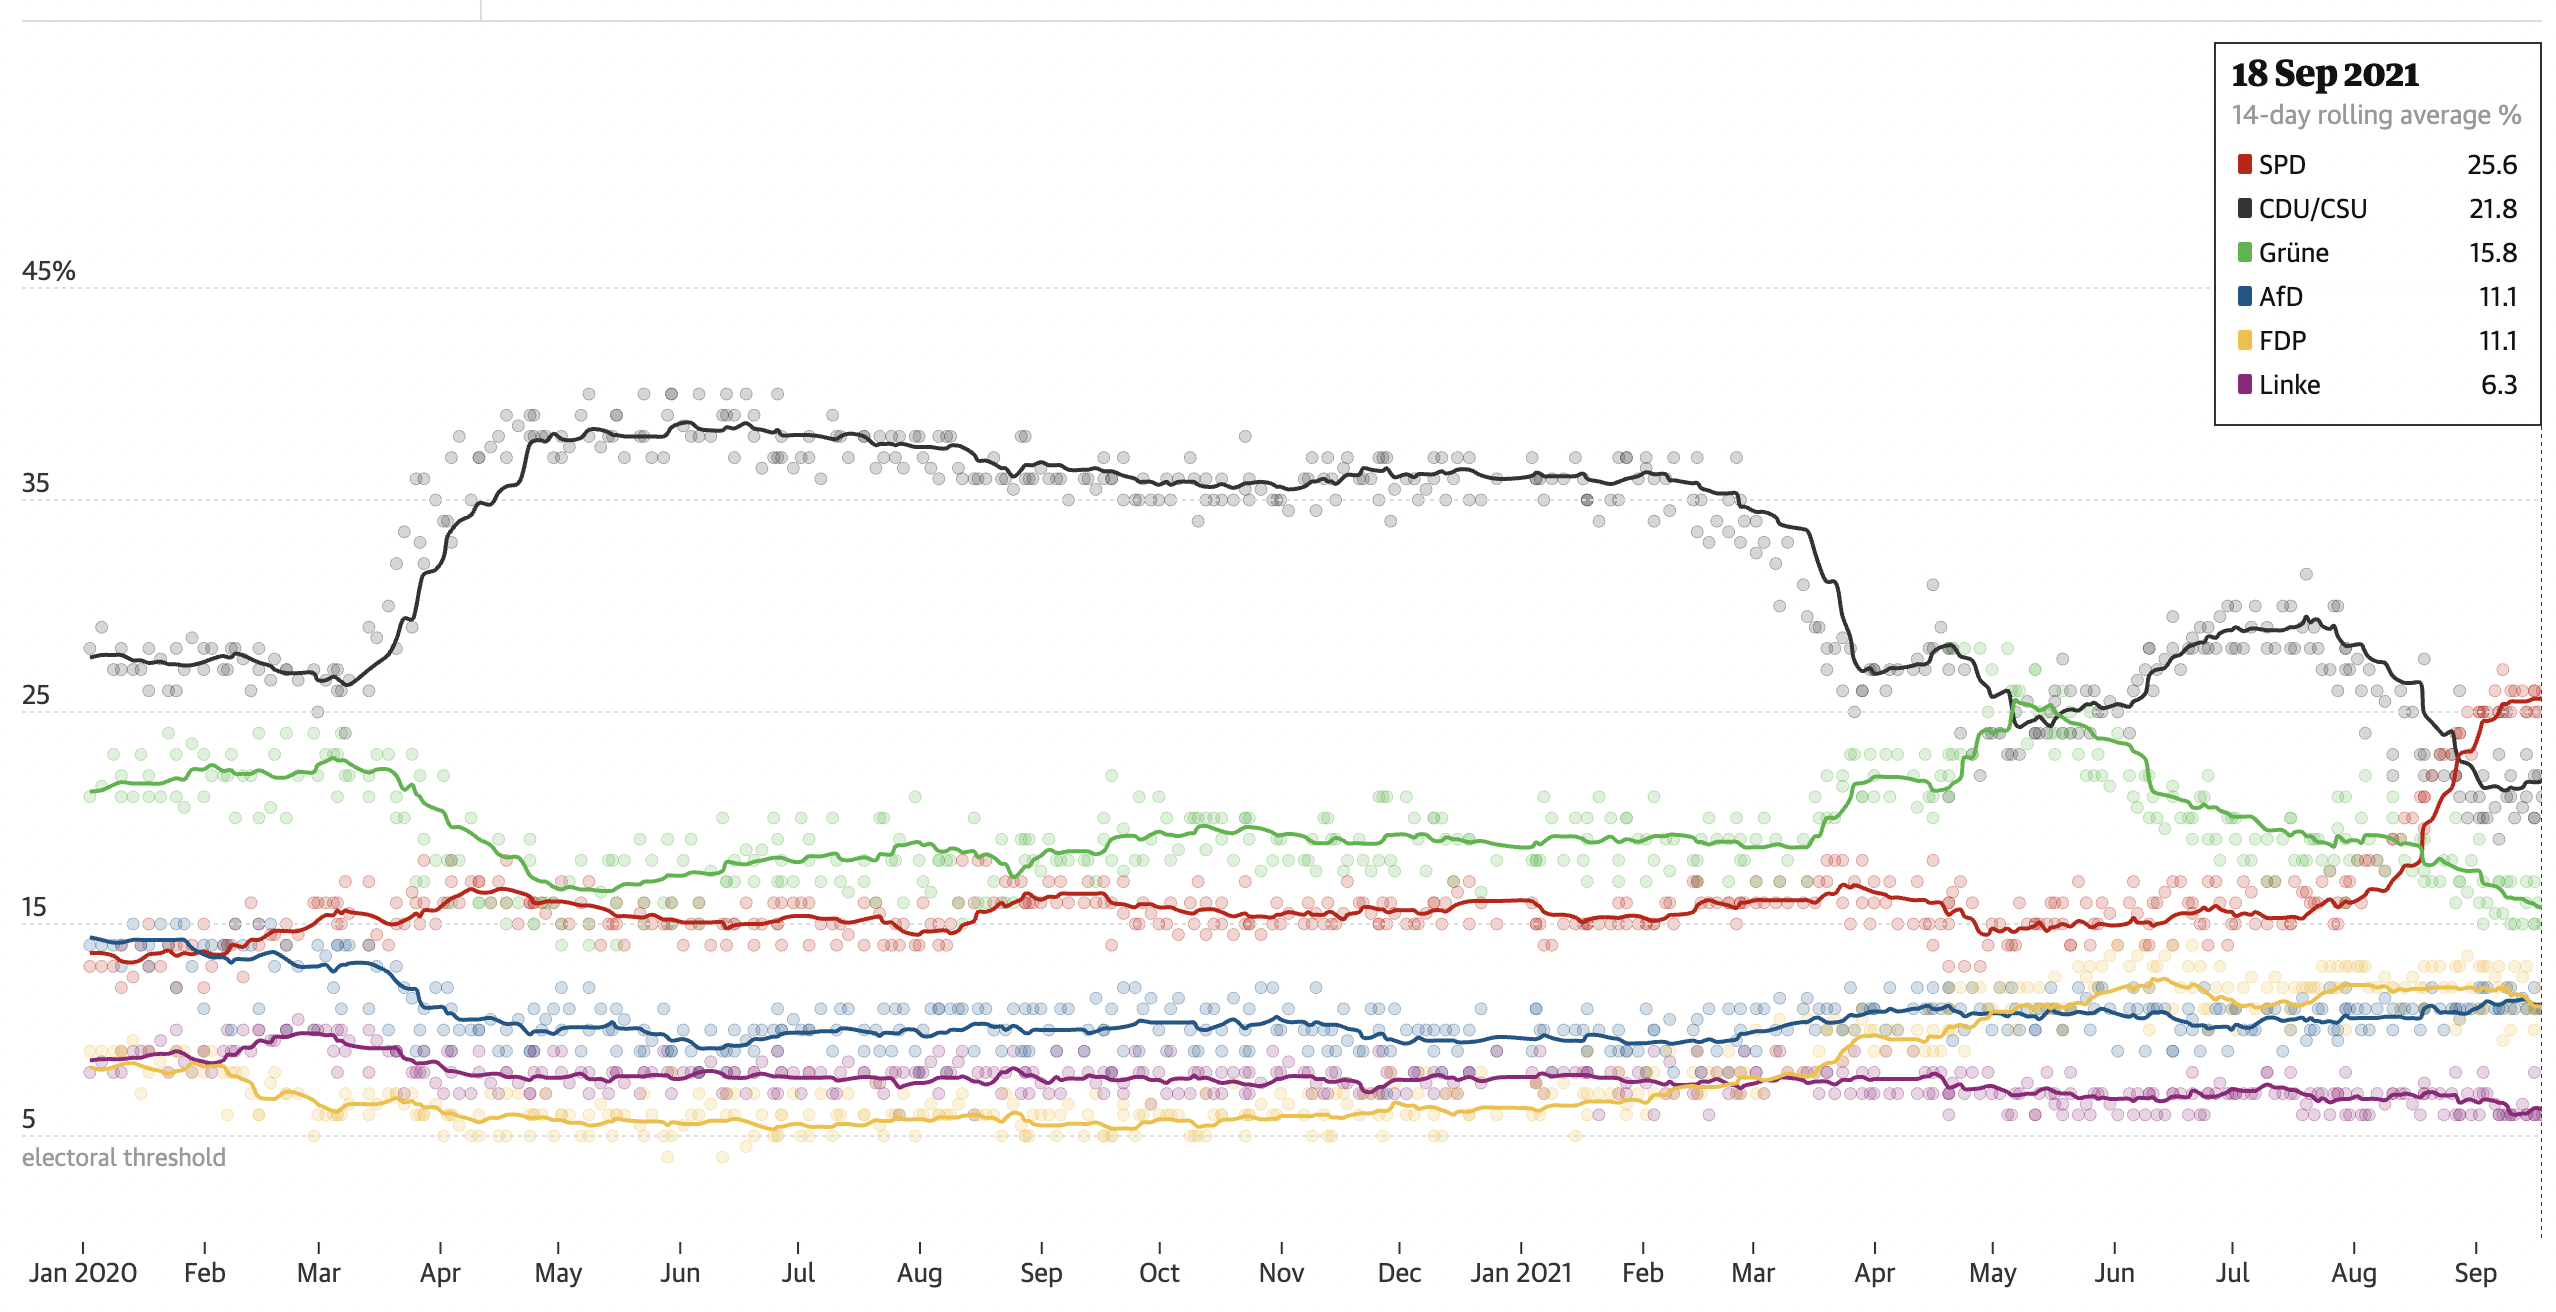
# https://www.economist.com/graphic-detail/who-will-succeed-angela-merkel
# https://www.theguardian.com/world/2021/jun/21/german-election-poll-tracker-who-will-be-the-next-chancellor
# get tables that exist on wikipedia page
tables <- url %>%
read_html() %>%
html_nodes(css="table")
# parse HTML tables into a dataframe called polls
# Use purr::map() to create a list of all tables in URL
polls <- map(tables, . %>%
html_table(fill=TRUE)%>%
janitor::clean_names())
# list of opinion polls
german_election_polls <- polls[[1]] %>% # the first table on the page contains the list of all opinions polls
slice(2:(n()-1)) %>% # drop the first row, as it contains again the variable names and last row that contains 2017 results
mutate(
# polls are shown to run from-to, e.g. 9-13 Aug 2021. We keep the last date, 13 Aug here, as the poll date
# and we extract it by picking the last 11 characters from that field
end_date = str_sub(fieldwork_date, -11),
# end_date is still a string, so we convert it into a date object using lubridate::dmy()
end_date = dmy(end_date),
# we also get the month and week number from the date, if we want to do analysis by month- week, etc.
month = month(end_date),
week = isoweek(end_date)
)Let’s now reproduce the graph made by the Guardian.
#First, we clean out some null values
german_election_polls$samplesize <- as.numeric(gsub(",","",german_election_polls$samplesize))
german_election_polls$samplesize <- as.numeric(german_election_polls$samplesize)
german_election_polls <- na.omit(german_election_polls)

#Next, we create the polls for each party
german_election_polls <- german_election_polls %>%
  mutate(union_votes = union*samplesize/100,
         spd_votes = spd*samplesize/100,
         af_d_votes = af_d*samplesize/100,
         fdp_votes = fdp*samplesize/100,
         linke_votes = linke*samplesize/100,
         grune_votes = grune*samplesize/100)

#Then, we make sure to get the daily polls of each party.
daily_german_election_polls <- german_election_polls %>%
  group_by(end_date) %>%
  summarise(total_sample_size = sum(samplesize),
            total_union = sum(union_votes),
            total_spd = sum(spd_votes),
            total_af_d = sum(af_d_votes),
            total_fdp = sum(fdp_votes),
            total_linke = sum(linke_votes),
            total_grune = sum(grune_votes))

#Next, we create an empty dataframe in which we'll later add the biweekly average for each party.
german_election_polls$end_date <- ymd(german_election_polls$end_date)

daily_german_election_polls$total_size_14day = NA
daily_german_election_polls$union_size_14day = NA
daily_german_election_polls$spd_size_14day = NA
daily_german_election_polls$af_d_size_14day = NA
daily_german_election_polls$fdp_size_14day = NA
daily_german_election_polls$linke_size_14day = NA
daily_german_election_polls$grune_size_14day = NA

#Let's now fill this dataframe with the biweekly averages.
for (i in 1:nrow(daily_german_election_polls)){
  current_day = daily_german_election_polls$end_date[i]
  day14 = current_day-14

  daily_german_election_polls$total_size_14day[i] = filter(daily_german_election_polls,
                                                           end_date<=current_day & end_date>day14) %>%
    select(total_sample_size) %>%
    sum()
  daily_german_election_polls$union_size_14day[i] = filter(daily_german_election_polls,
                                                           end_date<=current_day & end_date>day14) %>%
    select(total_union) %>%
    sum()
  daily_german_election_polls$spd_size_14day[i] = filter(daily_german_election_polls,
                                                         end_date<=current_day & end_date>day14) %>%
    select(total_spd) %>%
    sum()
  daily_german_election_polls$af_d_size_14day[i] = filter(daily_german_election_polls,
                                                          end_date<=current_day & end_date>day14) %>%
    select(total_af_d) %>%
    sum()
  daily_german_election_polls$fdp_size_14day[i] = filter(daily_german_election_polls,
                                                         end_date<=current_day & end_date>day14) %>%
    select(total_fdp) %>%
    sum()
  daily_german_election_polls$linke_size_14day[i] = filter(daily_german_election_polls,
                                                           end_date<=current_day & end_date>day14) %>%
    select(total_linke) %>%
    sum()
  daily_german_election_polls$grune_size_14day[i] = filter(daily_german_election_polls,
                                                           end_date<=current_day & end_date>day14) %>%
    select(total_grune) %>%
    sum()

}

daily_german_election_polls <- daily_german_election_polls %>%
  mutate(union_rate_14d = union_size_14day/total_size_14day,
         spd_rate_14d = spd_size_14day/total_size_14day,
         af_d_rate_14d = af_d_size_14day/total_size_14day,
         fdp_rate_14d = fdp_size_14day/total_size_14day,
         linke_rate_14d = linke_size_14day/total_size_14day,
         grune_rate_14d = grune_size_14day/total_size_14day,
         union_rate = total_union/total_sample_size,
         spd_rate = total_spd/total_sample_size,
         af_d_rate = total_af_d/total_sample_size,
         fdp_rate = total_fdp/total_sample_size,
         linke_rate = total_linke/total_sample_size,
         grune_rate = total_grune/total_sample_size)
#Now, let's plot our data according to the parties' official colors.
colors <- c("Union" = "black", "SPD" = "red", "AfD" = "blue",
"FDP" = "yellow", "Linke" = "purple", "Grune" = "green")
ggplot(daily_german_election_polls, aes(x=end_date)) +
geom_point(aes(y=union_rate), color="black", size=0.9, alpha=0.3) +
geom_line(aes(y=union_rate_14d, color="Union"), size=0.7) +
geom_point(aes(y=spd_rate), color="red", size=0.9, alpha=0.3) +
geom_line(aes(y=spd_rate_14d, color="SPD"), size=0.7) +
geom_point(aes(y=af_d_rate), color="blue", size=0.9, alpha=0.3) +
geom_line(aes(y=af_d_rate_14d, color="AfD"), size=0.7) +
geom_point(aes(y=fdp_rate), color="yellow", size=0.9, alpha=0.3) +
geom_line(aes(y=fdp_rate_14d, color="FDP"), size=0.7) +
geom_point(aes(y=linke_rate), color="purple", size=0.9, alpha=0.3) +
geom_line(aes(y=linke_rate_14d, color="Linke"), size=0.7) +
geom_point(aes(y=grune_rate), color="green", size=0.9, alpha=0.3) +
geom_line(aes(y=grune_rate_14d, color="Grune"), size=0.7) +
theme_bw() +
labs(title="German election poll tracker: who will be the next chancellor?",
x="Date",
y="Vote Percentage",
color = "Legend") +
scale_y_continuous(labels = scales::percent) +
scale_colour_manual(values = colors)